Introduction
In the process optimization world, a clear understanding of the steps involved is crucial. One of the most effective tools for visualizing and streamlining processes is the flow chart. In this guide, we’ll delve into flow charts using a practical example and explore how they can be integrated with tools like Typeform surveys and Camunda for efficient workflow management.
Introduction to Flow Charts:
Flow charts are graphical representations of a process, displaying the steps and decision points involved in a workflow. They provide a visual roadmap for understanding how tasks are completed and where potential bottlenecks may occur. Whether you’re managing a manufacturing operation or coordinating a complex project, flow charts offer invaluable insights into your processes.
Example Scenario:
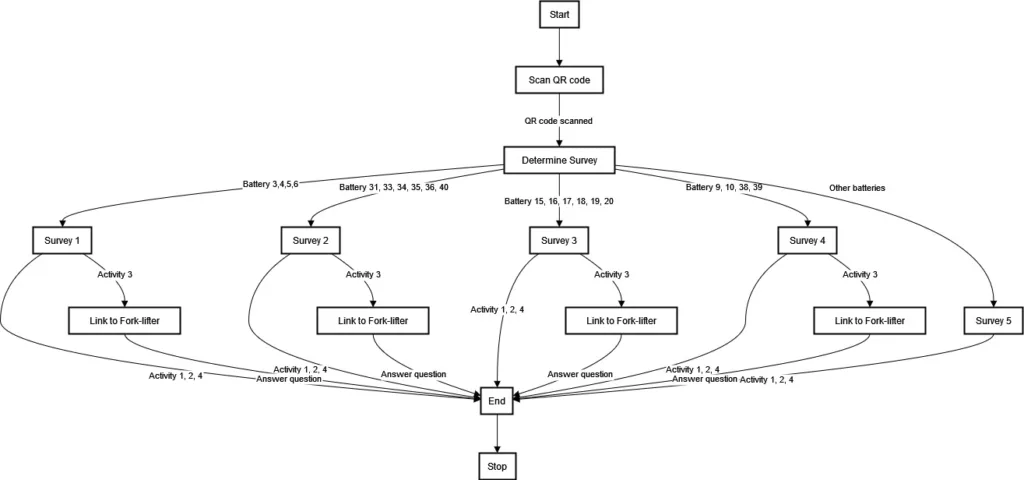
Imagine you’re responsible for managing 54 batteries for forklifts, each marked with a QR code. The process for maintenance and tracking involves several steps:
- Scan QR code.
- Determine survey type based on the QR code.
- Answer survey questions based on activities performed.
- If certain activities are chosen, additional information is required.
- Finally, the process concludes.
To simplify the flow chart, let’s group the batteries into five categories based on their QR codes.
Flow Chart Creation:
Using the example scenario, we’ll create a flow chart to visualize the process. We’ll break down the steps into manageable components and illustrate the flow using Mermaid code. This will help us understand the sequence of actions and decision points involved in managing the batteries efficiently.

The Mermaid code for the given example is:
graph TD;
Start[Start] –> ScanQR[Scan QR code];
ScanQR –>|QR code scanned| DetermineSurvey[Determine Survey];
DetermineSurvey –>|Battery 3,4,5,6| Survey1[Survey 1];
DetermineSurvey –>|Battery 31, 33, 34, 35, 36, 40| Survey2[Survey 2];
DetermineSurvey –>|Battery 15, 16, 17, 18, 19, 20| Survey3[Survey 3];
DetermineSurvey –>|Battery 9, 10, 38, 39| Survey4[Survey 4];
DetermineSurvey –>|Other batteries| Survey5[Survey 5];
Survey1 –>|Activity 1, 2, 4| End[End];
Survey1 –>|Activity 3| LinkToFL1[Link to Fork-lifter];
Survey2 –>|Activity 1, 2, 4| End[End];
Survey2 –>|Activity 3| LinkToFL2[Link to Fork-lifter];
Survey3 –>|Activity 1, 2, 4| End[End];
Survey3 –>|Activity 3| LinkToFL3[Link to Fork-lifter];
Survey4 –>|Activity 1, 2, 4| End[End];
Survey4 –>|Activity 3| LinkToFL4[Link to Fork-lifter];
Survey5 –>|Activity 1, 2, 4| End[End];
End –>Stop[Stop];
LinkToFL1 –>|Answer question| End[End];
LinkToFL2 –>|Answer question| End[End];
LinkToFL3 –>|Answer question| End[End];
LinkToFL4 –>|Answer question| End[End];
Using Typeform Surveys and Webhooks:
In our scenario, we’ll utilize Typeform surveys to gather information about the maintenance activities performed on each battery. We can collect relevant data efficiently by setting up specific surveys for each battery category. Webhooks will enable us to receive survey responses automatically, streamlining the data collection process.
Integration with Camunda:
Camunda is a powerful workflow automation tool that allows us to model and execute complex processes like the one described in our flow chart. By representing our process using BPMN notation, we can seamlessly integrate Typeform surveys and other external systems with Camunda, enabling end-to-end process automation and optimization.
Conclusion:
Flow charts serve as invaluable tools for visualizing and optimizing workflows. By breaking down complex processes into manageable steps, we can identify areas for improvement and implement solutions effectively. Integrating tools like Typeform surveys and Camunda further enhances our ability to streamline processes and drive efficiency. As you embark on your journey of workflow optimization, remember the power of visualization in understanding and improving your processes.


Leave a Reply